Quillattice · illustrative portfolio

A question, a pattern, a clearer explanation.

Four illustrative education samples show how Quillattice approaches learning content, mathematical data analysis, presentations and visual assets, and educational video planning.

AI supports exploration and drafting; mathematical judgement, classroom context and human review shape each deliverable before it is shared. The contexts and sample values are illustrative; they do not describe clients, engagements or outcomes.

Four illustrative sample sets

A glimpse of the work.

Each sample pairs an education context with a representative piece of output.

01Learning content

Illustrative sample · not completed client work

Founder review pending · no pupil use or learning outcome recorded.

A worked example that makes each step visible.

Education context

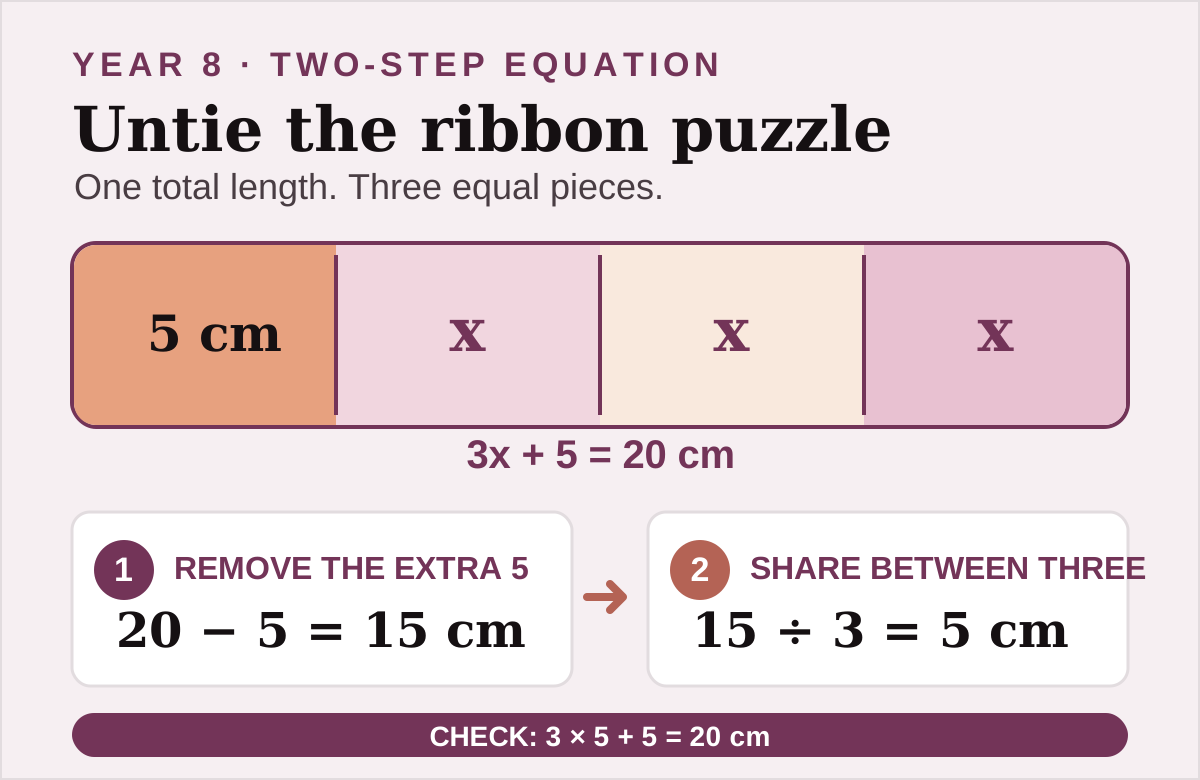
A proposed Year 8 mathematics practice resource for introducing a two-step linear equation through a short length puzzle.

Explore the worked example
Representative outputWorked example · algebra
Illustrative Year 8 ribbon puzzle: a 20 centimetre ribbon is split into a 5 centimetre piece and three equal x pieces, then solved as 3x + 5 = 20 to give x = 5 centimetres.

Proposed teaching idea only; this artwork is not completed client work or an actual customer outcome.

Year 8 · Solve the equation

A ribbon is 20 cm long.

Set aside 5 cm. Cut the rest into 3 equal pieces. How long is each piece?

3x + 5 = 20

  1. 1

    Subtract 5 from both sides

    3x = 15
  2. 2

    Divide both sides by 3

    x = 5 cm

Check: 3 × 5 + 5 = 20 cm.

Quick check: which inverse operation removes the +5?
02Mathematical data analysis

Illustrative sample · not completed client work

Summarise a small practice set without overreading it.

Education context

A hypothetical fractions practice set, shown as an example of clear summary statistics for an education question.

Representative outputSynthetic example · scores out of 10
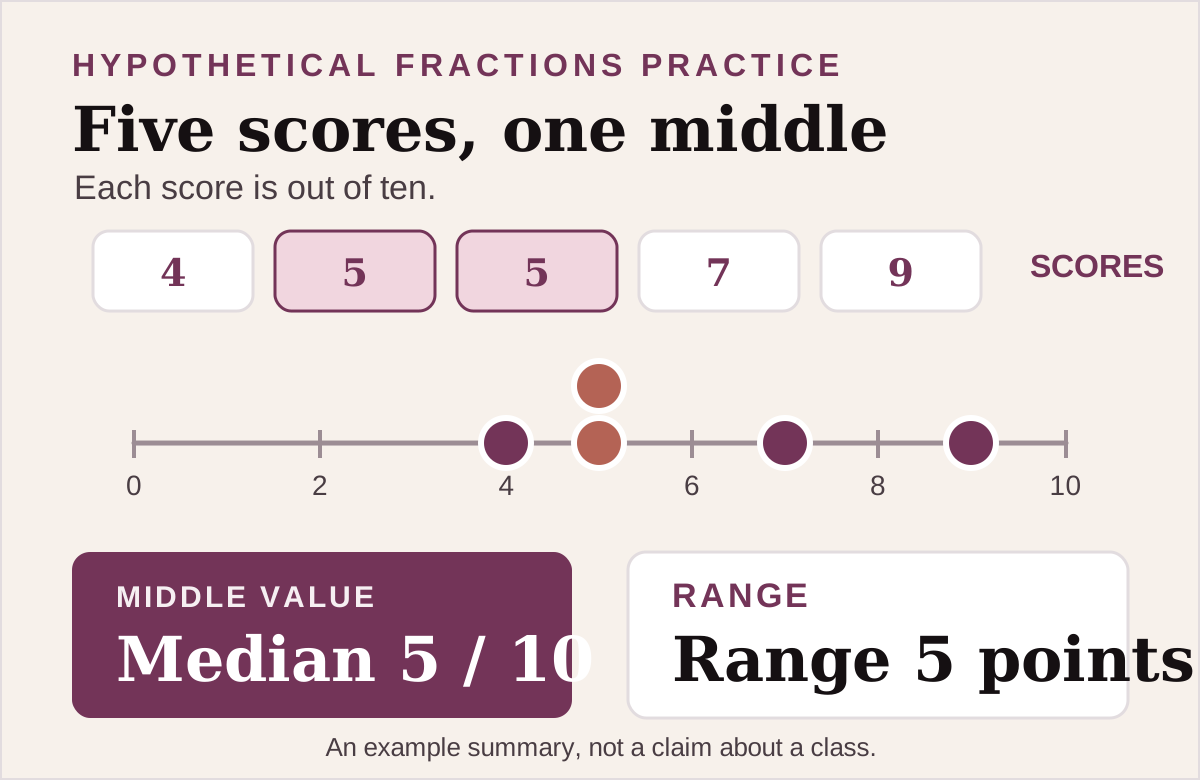
Illustrative dot plot of hypothetical fractions practice scores 4, 5, 5, 7 and 9 out of 10, highlighting the median score of 5 out of 10 and a 5-point range.

Hypothetical practice data only; this artwork is not completed client work or an actual customer outcome.

A five-value illustration

Fractions practice check

  1. 4
  2. 5
  3. 5
  4. 7
  5. 9
Median5 / 10The middle value
Range5 points9 minus 4

A five-value example cannot tell us what an entire class understands.

03Presentations and visual assetsEducational video planning

Illustrative sample · not completed client work

One mathematics idea, shaped for a slide and a short video plan.

Education context

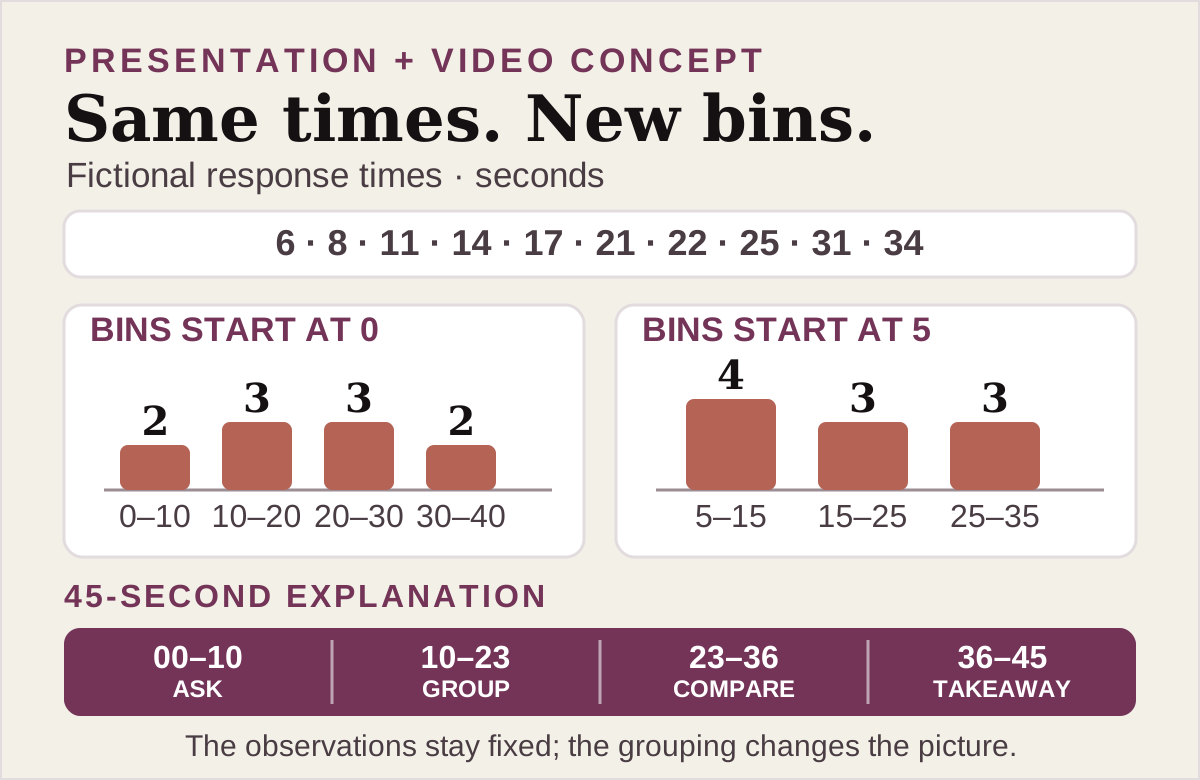
A proposed classroom explanation of how histogram bin choices can change the shape of a visual summary.

Representative outputsTeaching slide + 45-second storyboard
Illustrative histogram lesson artwork using fictional response times 6, 8, 11, 14, 17, 21, 22, 25, 31 and 34 seconds, comparing counts for bins starting at 0 with 2, 3, 3 and 2 against bins starting at 5 with 4, 3 and 3, alongside a proposed 45-second storyboard timeline.

Proposed slide and video concept only; this artwork is not completed client work or an actual customer outcome.

Slide opener · histogram bins

One set. Different bins. Different shape.

Same fictional response times: 6, 8, 11, 14, 17, 21, 22, 25, 31, 34 seconds.

Bins start at 0

  1. 0–10 2
  2. 10–20 3
  3. 20–30 3
  4. 30–40 2

Bins start at 5

  1. 5–15 4
  2. 15–25 3
  3. 25–35 3

Counts use half-open bins to include each fictional value once; this is not a real assessment or evidence of an outcome.

45-second video storyboard · voiceover + screen cues

  1. 00:00–00:10

    Voiceover: If the observations stay fixed, can the histogram still look different? On screen: ten fictional response times.

  2. 00:10–00:23

    Voiceover: With bins beginning at zero, the counts are 2, 3, 3 and 2. On screen: the first histogram and its bin labels.

  3. 00:23–00:36

    Voiceover: Start the bins at five; the counts become 4, 3 and 3. On screen: both groupings side by side.

  4. 00:36–00:45

    Voiceover: The data stays the same; the grouping changes the picture. On screen: the takeaway beside both histograms.

04Presentations and visual assets

Illustrative sample · not completed client work

Show one fraction in more than one way.

Education context

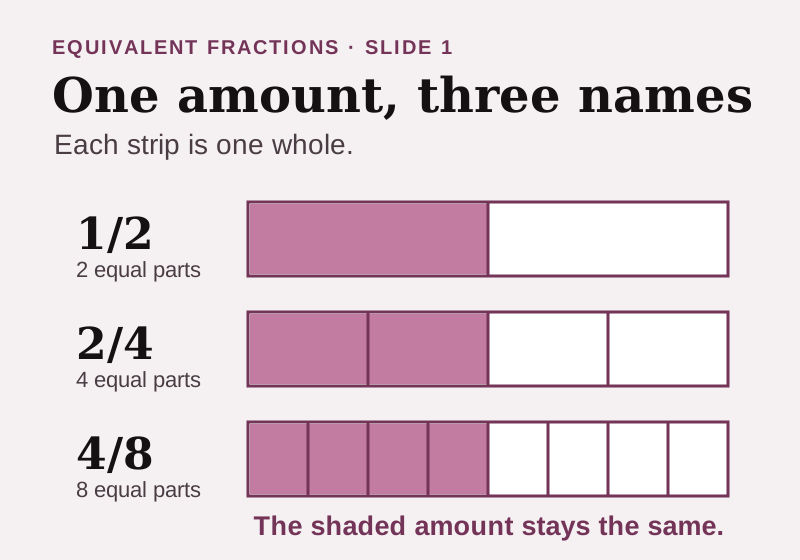
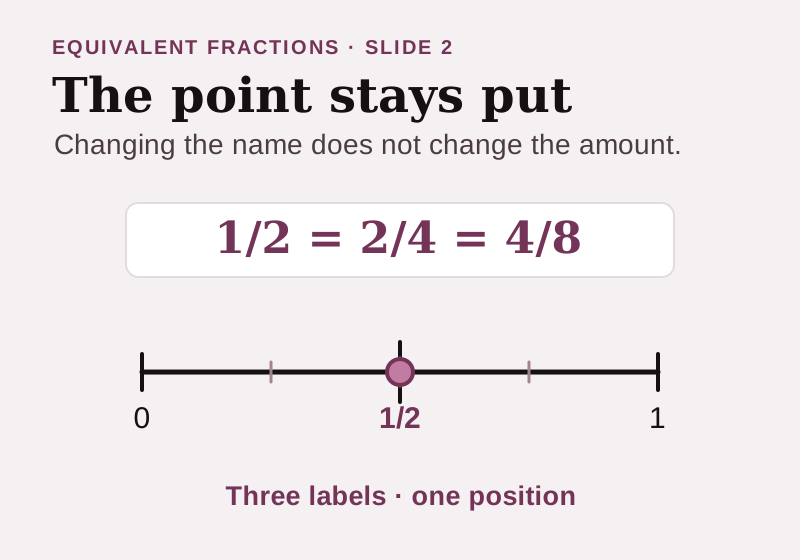
A proposed Year 7 mini-deck connects the area models and number-line position for 1/2, 2/4 and 4/8. It demonstrates how Quillattice can shape a concise teaching idea into presentation slides and supporting visual assets.

Illustrative service example only; it was not commissioned by a client or used with learners.

Representative outputsTwo illustrative teaching slides
Slide preview with three equal-length fraction strips: one of two parts, two of four parts, and four of eight parts are shaded, showing that each strip represents one half of a whole.
Slide 1 · Area modelsThe shaded part stays the same as each whole is divided into more equal parts.
Slide preview of a number line from zero to one, with one half marked at the midpoint and the equivalent labels 1/2, 2/4 and 4/8 grouped at that same position.
Slide 2 · Number lineDifferent fraction names can point to the same amount: one half.

Teaching takeaway: the denominator names equal parts; the numerator counts the parts being considered.

How the approach works

AI can help draft. Human judgement shapes what is shared.

AI supports exploration and drafting. Before work is shared, a human reviewer applies mathematical judgement and classroom context to check accuracy, clarity and fit to the brief.

The examples above are illustrative teaching materials, not completed client work or evidence of customer outcomes.

Read how we approach learning access and inclusion

Have a brief in mind?

Tell us what would be useful.

Tell us about your project